An Investigation into Lloyd's Relaxation
June 1, 2024 (4mo ago)
I recently came across this mezmerizing visualization of the Lloyd's relaxation algorithm by Jason Davies. I was curious how it was managed to be rendered at a reasonable frame-rate and decided to try and reproduce the effect from scratch.
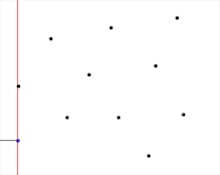
To summarize a bit of what is going on here: basically you have a number of points in a 2d region -- in this case they all start close to the middle of the region with some random scatter. Then you compute the Voronoi diagram for those points. Then in every iteration you then compute the centroid of those Voronoi cells and move the point towards that centroid.
The amazing this is that this eventually "relaxes" into a somewhat stable / repetitative tessellation of the 2d region.
Here I will detail my experiment in trying to implement this from scratch.
Computing the Voronoi Diagram
If we break down the things we need in order to accomplish an implementation similar to the one on Davies' site we need:
- An algorithm to compute the Voronoi diagram
- An algorithm to compute the centroid of a polygon given it's edges
Let's focus on the first point for now: computing a Voronoi diagram. There are many interesting algorithms for computing Voronoi diagrams, but since we are not sure where in our rendering the bottleneck will be -- let's start with a nieve approach and iterate from there.
The naieve approach
What is a Voronoi diagram? it is a way of partitioning a 2D plane into regions based on the distance to a specific set of points. The regions are called Voronoi cells and the points are called sites.
The cells are defined by the set of points that are closer to a specific site than any other site. To compute these using a brute-force approach we can use an approach by which we compute the bisector of pairs of points and iteratively clip out the regions that are not part of the Voronoi cell.
A very nice youtube video illustrates this approach.
This algorithm runs in time complexity -- which is not great but it is a start.
It's quite fast to compute a diagram on a modern machine for a handful of points. However, if we look at Davies original diagram he is computing a diagram for about 1,000 points at 60FPS. This is not going to cut it.
Fortune's Algorithm
A very beautiful algorithm exists for computing Voronoi diagrams in time complexity. This is called Fortune's Algorithm. It is a sweep-line algorithm in which you sweep a line across the plane and compute the Voronoi diagram as you go, growing cells as they come into contact with the sweep-line.
Here is an animated view of how this looks like:
I wanted to render the Voronoi diagram using C and WebAssembly and faced a couple of small challenges along the way.
- Fortune's original implementation (also in C) is not very well documented and is not organized in a way that makes it easy to merge into a project that would allow me to render it on the web.
- There is a really cool implementation from Jaques Heunis in C++ that is very well documented and easy to understand. However, I wanted to use C for this project.
So I took the liberty of translating Heunis' implementation into C. You can find the code for that here.
Implementing Lloyd's Relaxation
Now that we have a way to compute the Voronoi diagram we can move on to the next step: computing the centroid of the Voronoi cells, which will allow us to then "relax" the cells by moving the voronoi vertex toward the cell centroid.
Greene's Theorem for Polygon Centroids
To compute the centroid of a polygon, we can use Greene's theorem, which is a special case of the more general Stokes' theorem. The centroid (or geometric center) of a polygon is the arithmetic mean position of all the points in the shape. Greene's theorem allows us to compute this by integrating over the polygon's edges.
For a polygon with vertices , the centroid can be computed as follows:
where (A) is the signed area of the polygon:
Using these formulas, we can iteratively move each point to the centroid of its Voronoi cell and watch as the diagram "relaxes."
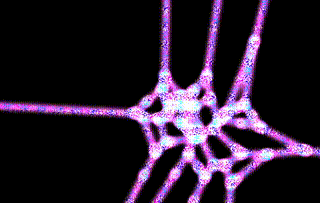
The Final Result
After implementing both the Voronoi diagram computation and the centroid calculation, I was able to create a working simulation of Lloyd's relaxation. The points start in a random configuration near the center of the region and, over time, move towards a more uniform distribution.
The final result is a visually appealing and somewhat hypnotic tessellation that stabilizes after a number of iterations. Here's a snapshot of the final result:
Problem-Solving Lessons
This project taught me several valuable lessons about problem-solving and algorithm implementation:
- Start Simple: Begin with a naive approach to understand the problem better before optimizing.
- Leverage Existing Work: Translating and understanding existing implementations can save a lot of time.
- Iterate and Improve: Optimization is an iterative process; start with a working solution and refine it.
Things I'm Not Happy With Still
While the implementation works, there are a few areas I am not entirely satisfied with:
- Performance: Although the final algorithm runs efficiently, there are still some performance bottlenecks, especially with large numbers of points.
- Code Readability: The translated code could be better documented and organized for readability and maintainability.
- Visualization: The rendering could be further optimized for smoother animations and better visual appeal.
Overall, this was a rewarding experiment in algorithm implementation and visualization. I look forward to exploring further optimizations and enhancements in the future.